South Carolina Health at a Glance: 2018 Live Healthy State Health Assessment Report Demographics
The first and award-winning South Carolina State Health Assessment was released in 2018 as a snapshot of South Carolina’s health indicators, issues, and potential outcomes. Because the document is pretty lengthy (approximately 346 pages to be exact), we will tackle each section at a glance and summarize the most pertinent information. Our first blog post introduced general information about the assessment, including contributors, definitions of indicators, issues, and possible outcomes, and why the assessment is important.
What is the demographic makeup of South Carolina?
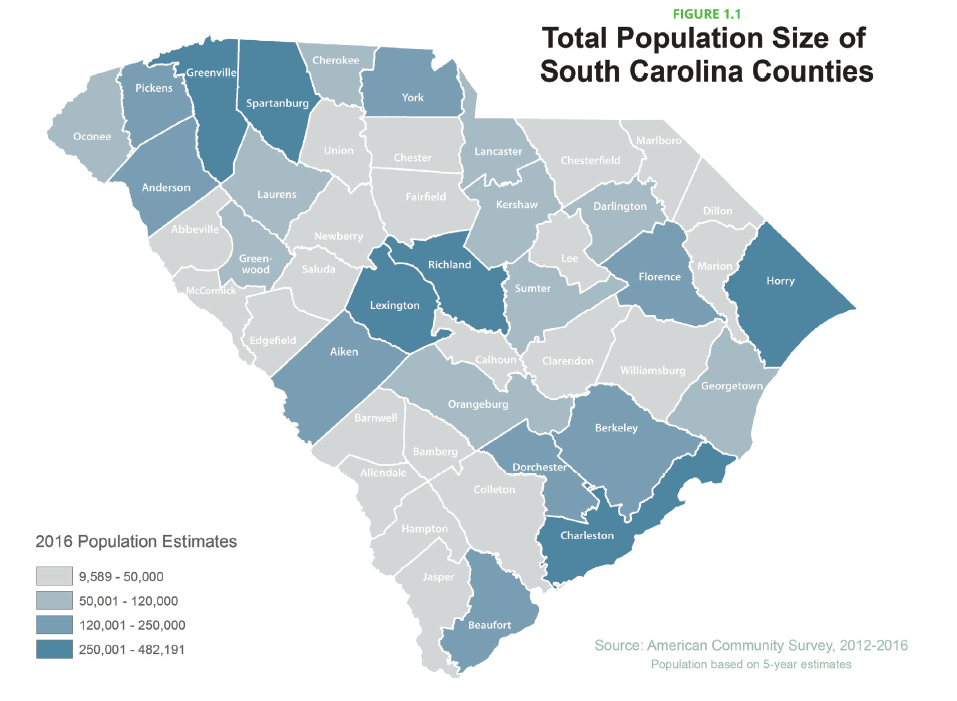
South Carolina’s population is growing consistently. The state population has increased from 4.6 million in 2010 to about 5 million in 2017, an increase of 8.6% compared to an overall 5.5% increase in the United States. In 2016, there were 4,961,119 residents in South Carolina. The five most populated counties in the state were:
- Greenville (482,191)
- Richland (401,743)
- Charleston (380,673)
- Horry (300,418)
- Spartanburg (294,229)
Men made up 48.5% of the population, while women were 51.5%.
Why is South Carolina’s population increasing?
The state’s growth is attributable to three main drivers:
- People within the country moving to South Carolina (67% increase)
- More births to South Carolina residents (23% increase)
- People outside of the United States moving to the state (10% increase)
Another factor can be attributed to the growing elderly community. The proportion of South Carolinians who are over 65 years old increased from 13.7% in 2010 to 16.7% in 2017.
Race/Ethnicity Makeup of South Carolina
The three largest racial/ethnic groups in South Carolina in 2016 were non-Hispanic Whites (3.1 million), non-Hispanic Blacks (1.3 million) and Hispanic/Latino (272,791). Of the Hispanic/Latino residents, 55.3% were of Mexican origin, 12% were from Puerto Rico, 5.2% from Guatemala, and 5.0% Honduras.
Marital Status
In 2016, nearly half of South Carolina residents, 15 years old and older, were married (46.2%); 32.7% of residents had never been married; 11.1% were divorced; 7.0% were widowed; and 3.0% were separated. The median age of first marriage was 29.9 years for men and 28.4 years for women.
Education Factors
From 2002 to 2017, the percentage of South Carolina students who graduated from high school increased from 77.3% in 2002 to 84.6% in 2017. In 2017, the South Carolina graduation rate was the highest it had been in 17 years.
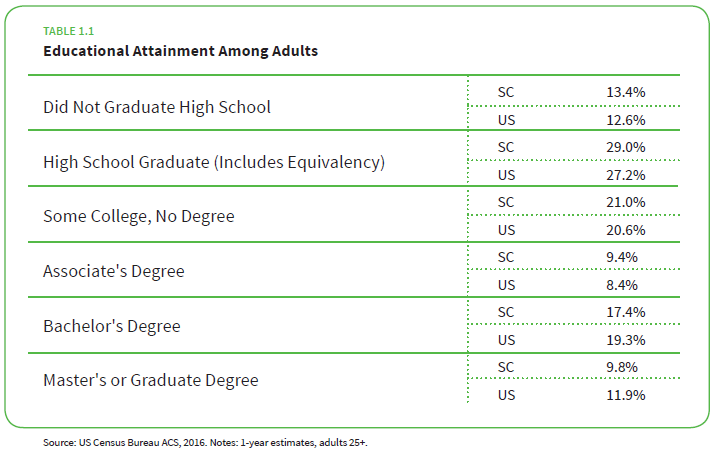
In nationwide comparison, South Carolina fairs well in educational attainment among adults. See below.
Income Levels
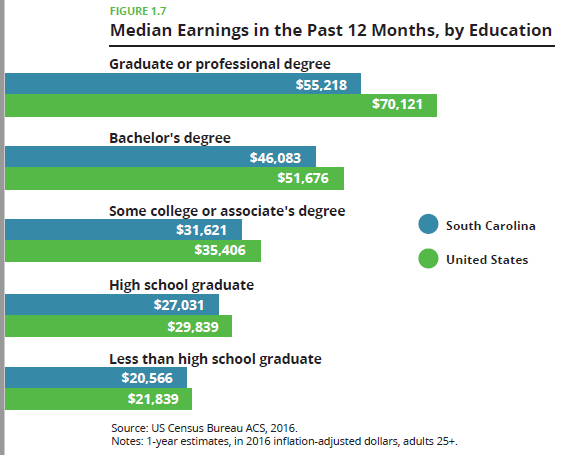
The median income for individuals varied based on the level of education obtained. As the level of education increased so did the median earnings. Individuals with a bachelor’s degree in South Carolina had median earnings of $46,083, compared to $51,676 for the United States. Median household income for South Carolina in 2016 was $48,501, compared to $57,617 for the United States.
Approximately 735,960 individuals (15.3%) lived below the federal poverty level (FPL). The 2018 FPL for individuals is $12,140 and for a family of four is $25,100. More than one-third of South Carolinians lived under 200% of the FPL (35.4%). This is higher than the percent of United States residents.
Housing
In 2016, 68.6% of homes in South Carolina were owner-occupied, while 31.4% were renter-occupied. The median rent was $841. The highest median rent was seen in Beaufort County at $1,170. Most homeowners paid between $1,000-$1,499 or $500-$999 on monthly owner costs. Selected monthly owner costs were calculated from the sum of payment for mortgages, real estate taxes, various insurances, utilities, fuels, mobile home costs, and condominium fees. The median South Carolina homeowner spent $1,182 on selected monthly owner costs.
South Carolina is a diverse and growing population. For more demographics, including disability status, languages spoken at home, and veteran status, view the full report.